Chapter 3
Spatial reference
Accompanies Module 3 · Spatial Reference Systems
Why this matters
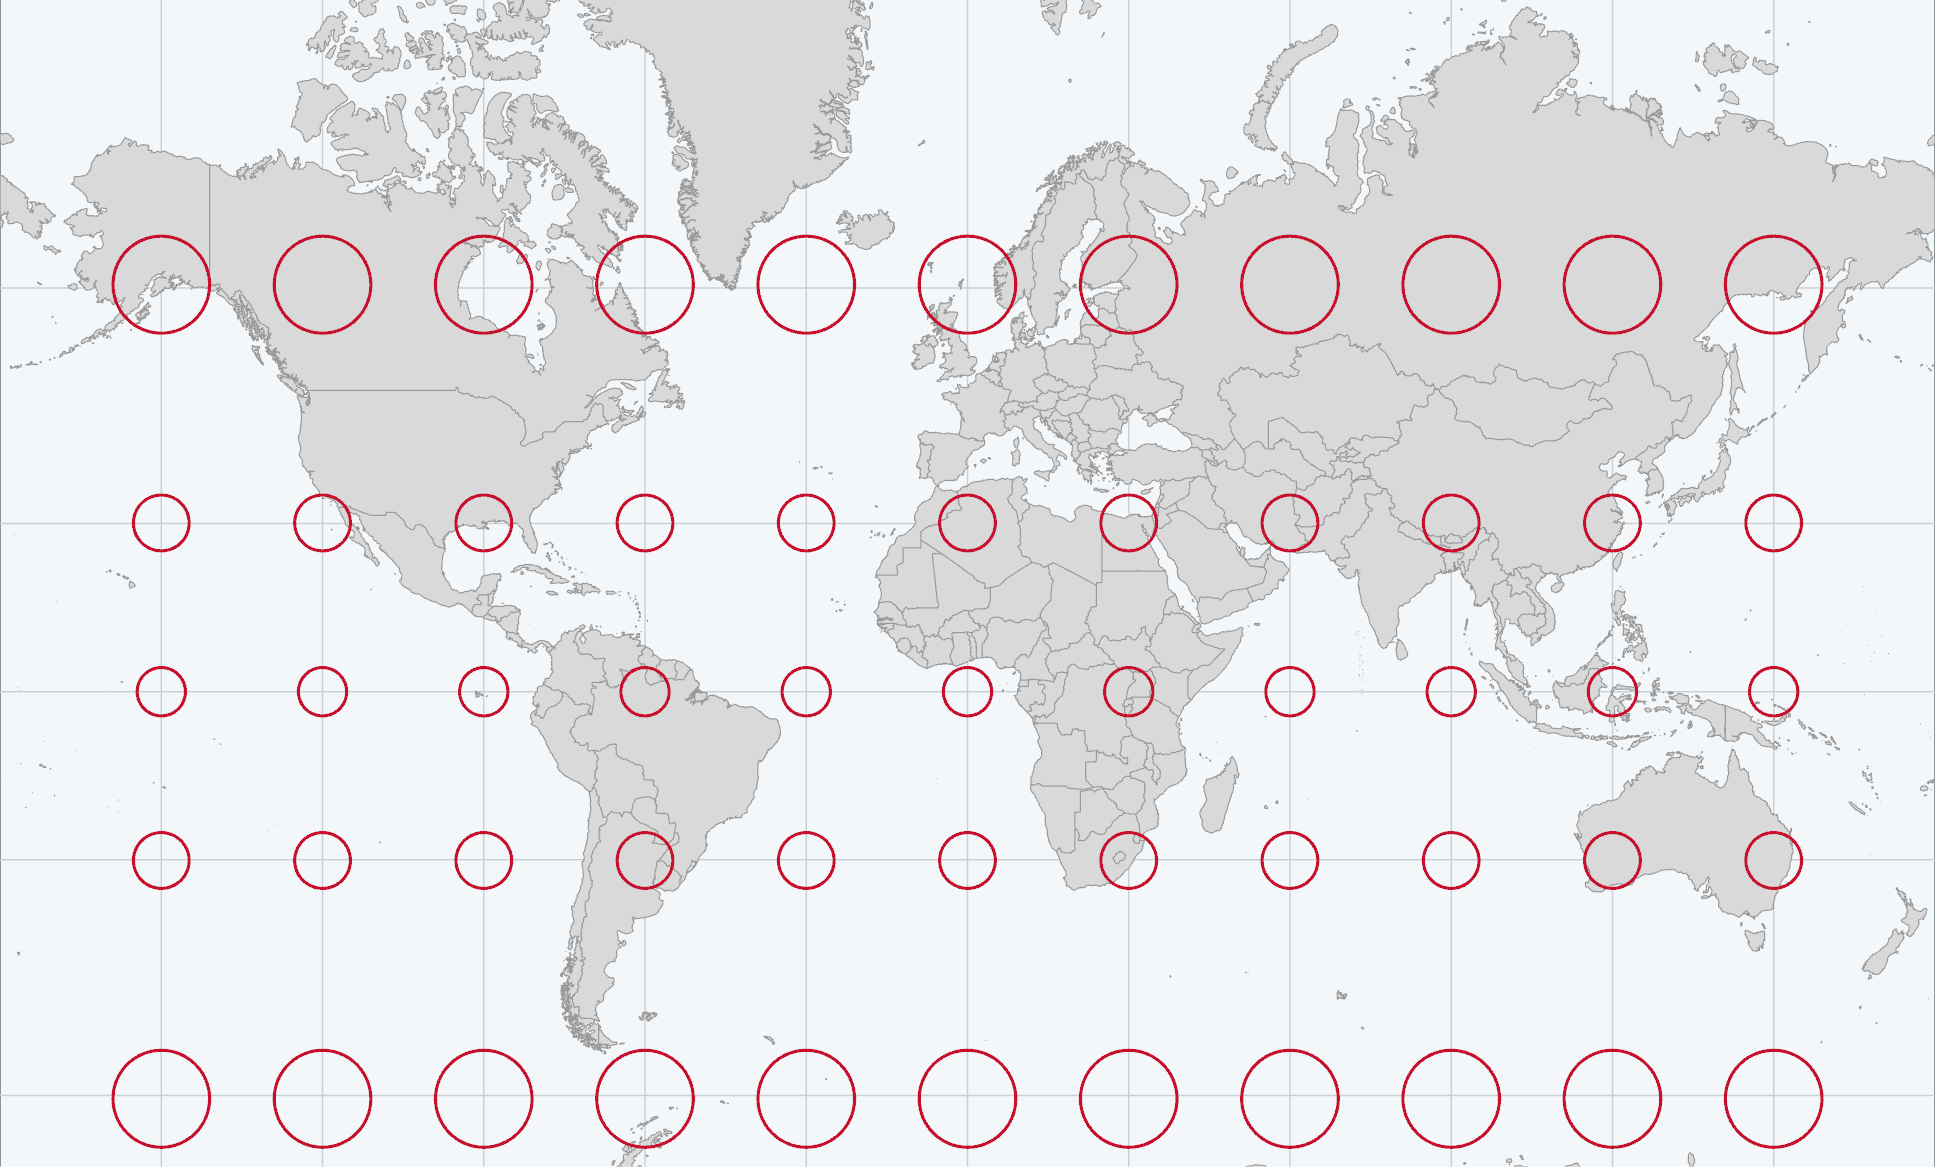
Every layer in a GIS stores locations as numbers, and those numbers identify a place only through the model of the Earth they refer to. If the model changes, the same numbers refer to a different place. Any flat map of the round Earth stretches some part of it: on the Mercator map above, every red circle is the same size on the ground. This chapter explains the models, which properties each one preserves, and how to choose a suitable one before you measure anything.
You should be able to explain
- why the same latitude and longitude name different places on different datums
- why no flat map keeps shape, area, distance and direction at once, and which a thematic map should keep
- why Dublin to Galway measures 311 km planar in Web Mercator but 187 km in Irish Transverse Mercator
The shape of the Earth
Describing where something is requires a model of the Earth's shape. For a desk globe, a sphere with a radius of about 6,371 km is the right model. The Earth's rotation, however, makes it bulge at the equator and flatten at the poles, so its shape is an ellipsoid (also called a spheroid), the shape produced by rotating an ellipse about its shorter axis.
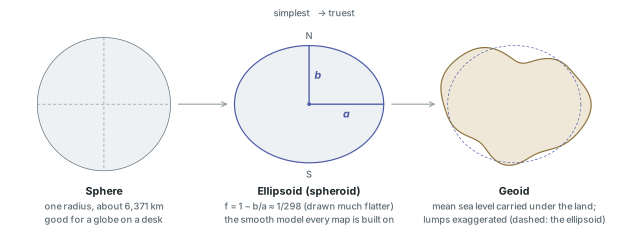
Two numbers define an ellipsoid: the equatorial radius a and the polar radius b. The degree to which it is squashed is the flattening, f = 1 − b/a. For the Earth f is about one part in three hundred, so GIS dialogs show its inverse, 1/f, which is easier to read. The WGS 84 ellipsoid, on which GPS reports positions, has a = 6,378,137 m exactly and 1/f = 298.257223563, which puts the poles about 21.4 km closer to the centre than the equator. On a globe 20 cm across that difference would be two-thirds of a millimetre, so globes are made as spheres; on maps the difference becomes significant at scales of about 1:100,000 and larger.
Surveyors have fitted many ellipsoids to the Earth over the past two centuries. The following are among those you will see on Pro's Source tab:
| Ellipsoid | a (m) | 1/f | Used by |
|---|---|---|---|
| WGS 84 | 6,378,137 | 298.257223563 | GPS, the WGS 1984 datum |
| GRS 80 | 6,378,137 | 298.257222101 | NAD 1983, ETRS89, Ireland's IRENET95 |
| Clarke 1866 | 6,378,206.4 | 294.98 | NAD 1927 (North America) |
| Airy Modified 1849 | 6,377,340.189 | 299.3249646 | Ireland 1965 (the old Irish Grid) |
WGS 84 and GRS 80 differ by about a tenth of a millimetre, so for mapping they can be treated as the same shape.
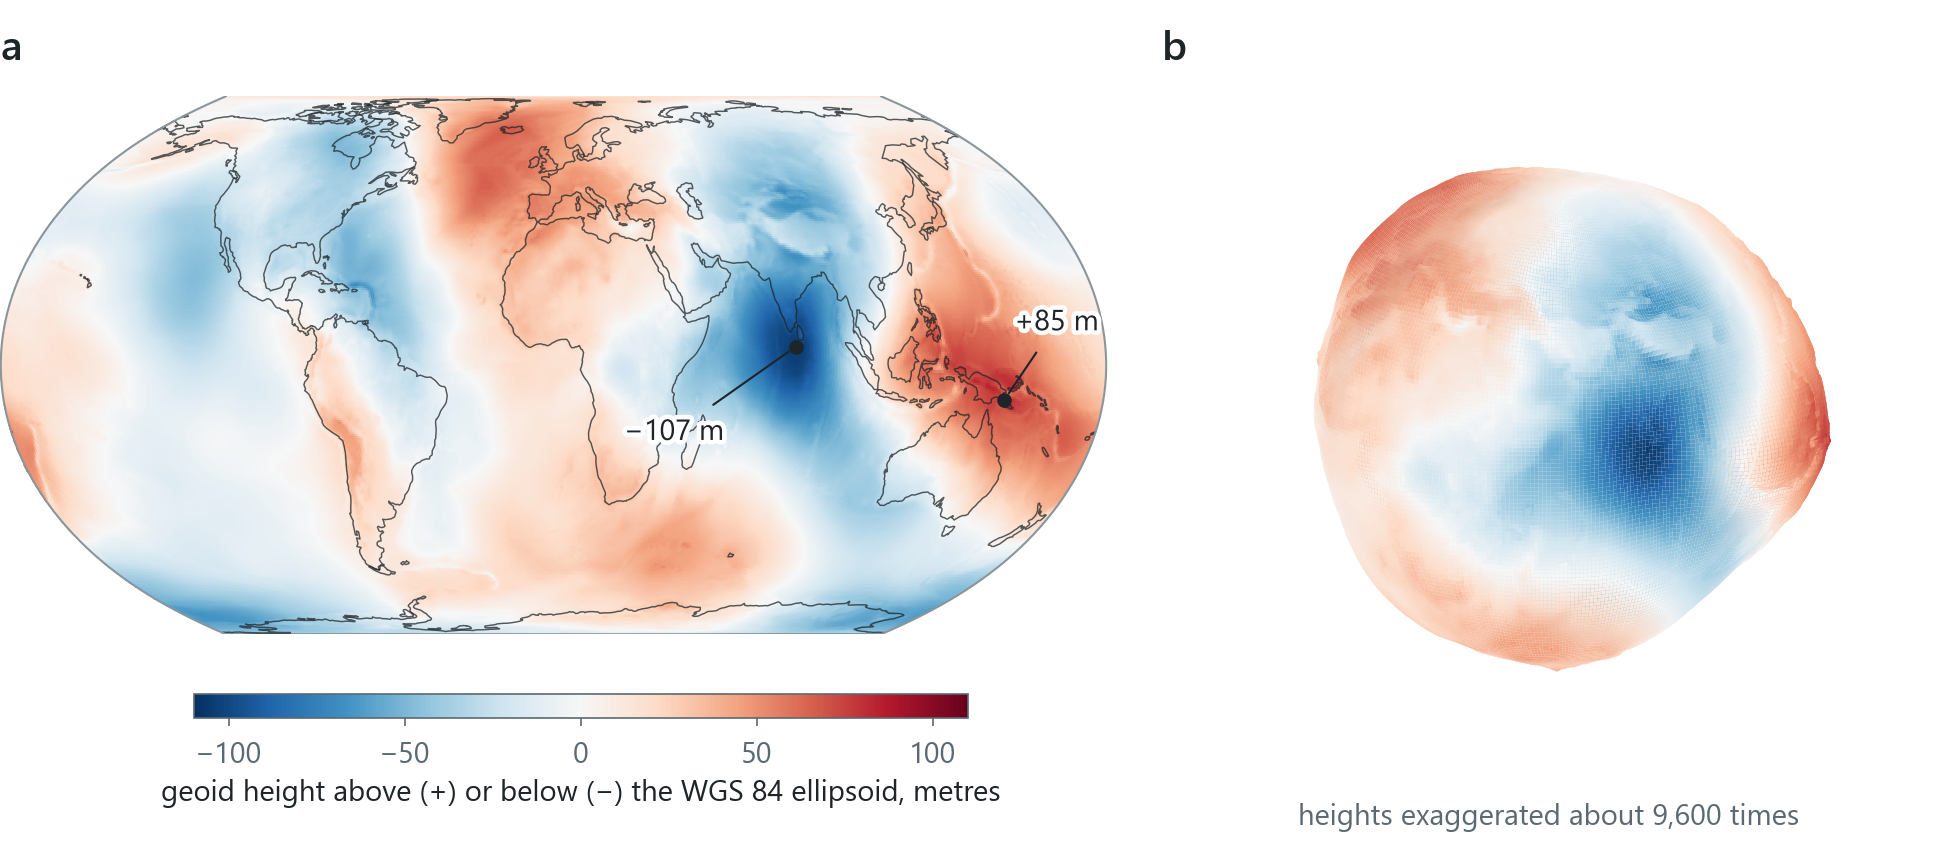
The ellipsoid is a smooth surface, but the real Earth is irregular. Mass is spread unevenly through the planet, so gravity pulls slightly harder in some places than in others. The geoid is the surface the oceans would take under the influence of gravity alone, extended under the continents; it corresponds to mean sea level everywhere. It rises and falls relative to a well-fitting ellipsoid by no more than about a hundred metres, but it is too irregular to be used for computing map coordinates. Each of the three shapes is therefore used for a different purpose: the sphere for globes and small world maps, the ellipsoid for latitude, longitude and every projection, and the geoid for heights, which are measured from sea level.
Datums: fitting the ellipsoid
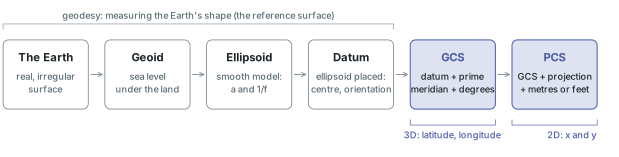
An ellipsoid defines a shape only. To use it as a reference for coordinates, you must also specify its position: where its centre is and how it is oriented. That specification is a datum, and a latitude and longitude identify one definite place only when the datum is known.
Before satellites, a country fixed its datum by surveying: the ellipsoid was fixed to one carefully measured point on the ground and every other survey point was computed from it. The North American Datum of 1927 (NAD 1927) was fixed at Meades Ranch, Kansas, on the Clarke 1866 ellipsoid; Ireland 1965 used Airy Modified 1849. Such local datums fit the geoid closely across their own region and depart from it elsewhere.
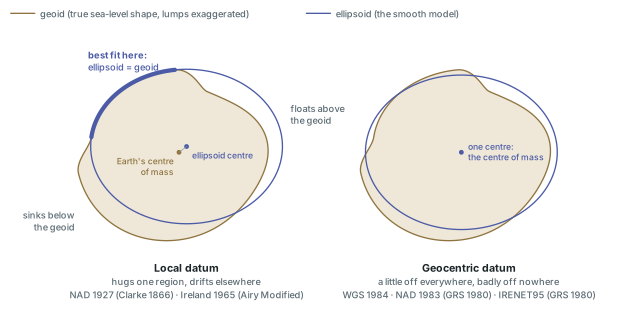
Satellite geodesy made geocentric datums possible. In a geocentric datum the ellipsoid's centre is placed at the Earth's centre of mass, and the ellipsoid fits the whole planet well without being the best fit for any one region. WGS 1984, NAD 1983 (on GRS 80) and IRENET95, Ireland's GPS-observed realisation of the European system ETRS89, are all geocentric. Datums are also revised from time to time as measurements improve.
Because the fit differs, the same physical point has different latitude and longitude on different datums. Moving from NAD 1927 to NAD 1983 shifts coordinates by amounts that reach 300 m; in Ireland the same spot on Ireland 1965 and on WGS 1984 differs by about 50 to 70 m. A coordinate recorded without its datum is therefore incomplete.
In the pane
Module 3 lesson 1 opens with a quiz on the Earth's shape, then covers the sphere, ellipsoid and geoid and the difference between local and geocentric datums. You read these properties on a real layer: its Source tab lists the Datum, the Spheroid, the two semi-axes and the Inverse Flattening, 298.257223563 for WGS 1984, and Waldo checks what you read against the layer.
Latitude and longitude
On the ellipsoid, a position is two angles. Latitude is the angle north or south of the equator, 0° to 90° at each pole. Longitude is the angle east or west of a prime meridian, 0° to 180° each way; longitude has no natural zero, and in 1884 an international conference chose the meridian through Greenwich. Lines of equal latitude are parallels, lines of equal longitude meridians, and the network of both is the graticule.
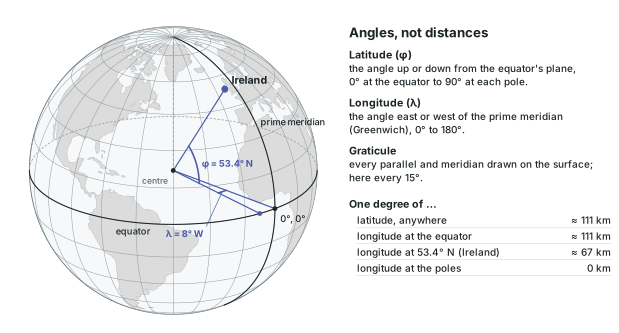
Dublin is at 53.3498° N, 6.2603° W in decimal degrees, or 53°20′59″ N, 6°15′37″ W in degrees, minutes and seconds (60 minutes to a degree, 60 seconds to a minute). Without letters, south and west are negative (−6.2603). Pro's coordinate readout prints longitude first, each value with its hemisphere letter.
Degrees measure angles rather than lengths. Because the meridians converge towards the poles, a degree of longitude shrinks with the cosine of the latitude: 111 km at the equator, 66.7 km at Dublin and 55.5 km at 60°, half the equatorial value. You can locate anything in latitude and longitude, but you cannot measure distance or area on them with flat geometry. (Strictly, on an ellipsoid the stored latitude is measured from the line perpendicular to the surface, not from the centre as on a sphere; the two differ by at most about a fifth of a degree.)
A geographic coordinate system (GCS) bundles the pieces: a datum (and so an ellipsoid), a prime meridian and an angular unit, degrees. The term "datum" is often used for the whole GCS, but the datum is only one of its parts.
In the pane
Module 3 lesson 2 has you watch the coordinate readout, switch it from decimal degrees to degrees-minutes-seconds, and add the Firefly Grid Lines graticule from the Living Atlas. You read Dublin's position, then open Map Properties > Coordinate Systems and read the Horizontal line under Current Map Coordinate Systems. This is the map's own coordinate system, which can differ from that of every layer.
Map scale
Every map shows the ground at a reduced size. Map scale is the ratio between a distance on the map and the same distance on the ground, and it can be written in three ways. A representative fraction (RF) such as 1:50,000 means that one unit on the map represents 50,000 of the same unit on the ground, whatever the unit. A verbal scale states the ratio in words ("one centimetre to five hundred metres"). A bar scale shows it as a graphic, and it is the only form that remains correct when a map is enlarged or reduced.
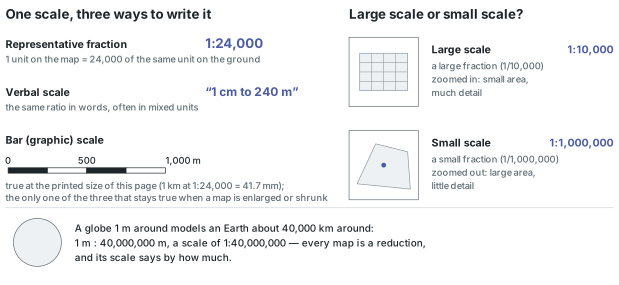
The terms can seem reversed until you recall that a scale is a fraction: 1:10,000 is a larger fraction than 1:1,000,000, so a large-scale map shows a small area in much detail and a small-scale map shows a large area with little. The equator is 40,075 km round, so a globe one metre round is a map at about 1:40,000,000.
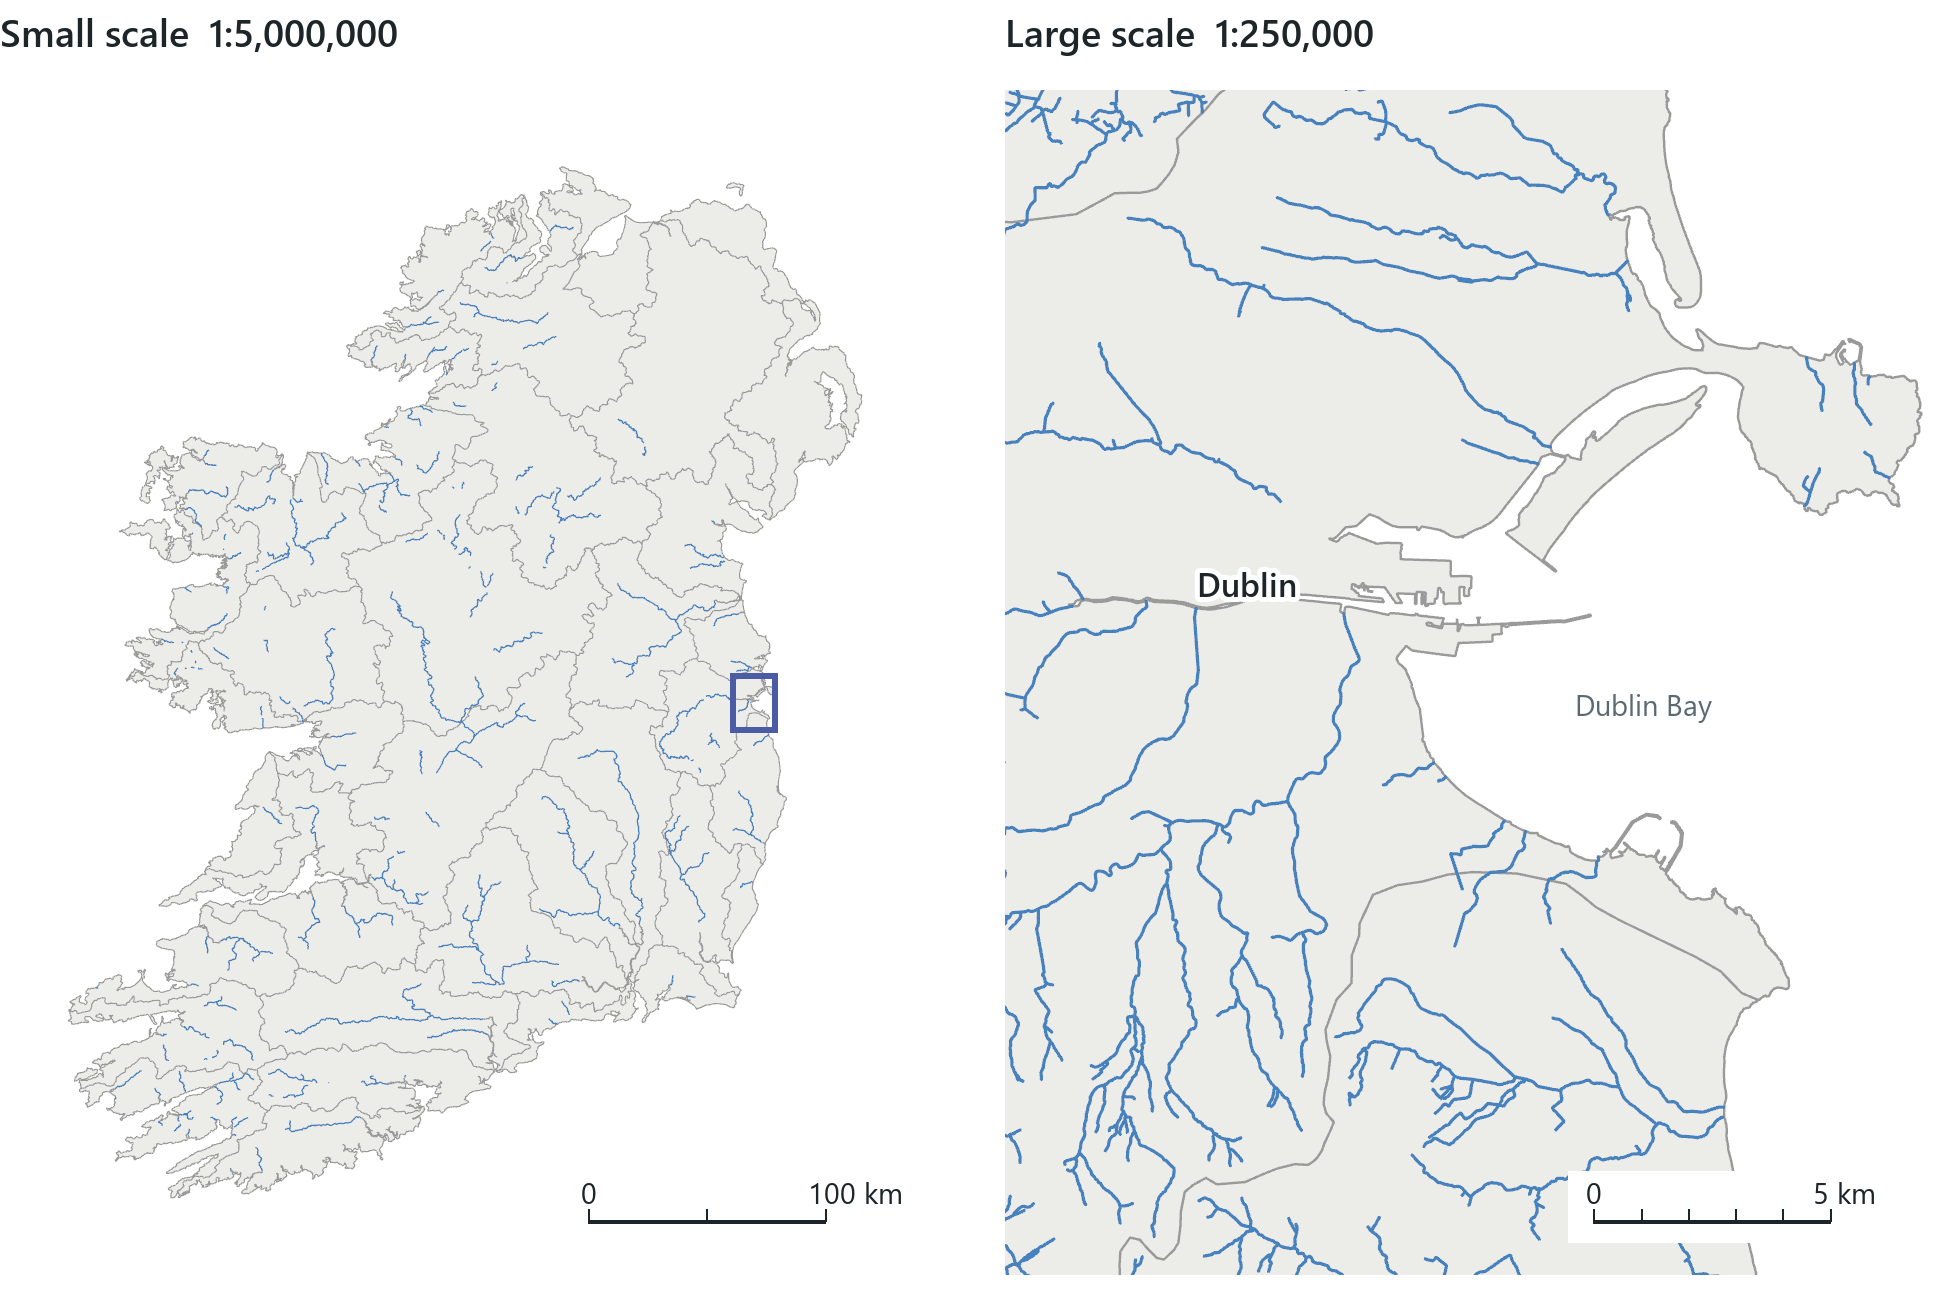
Scale limits the detail a map can show. The eye can separate marks about 0.2 mm apart, so at 1:50,000 a mark 0.2 mm wide represents 10 m of ground. Anything narrower, such as a path or a stream, can be shown only with an enlarged or simplified symbol, and the drawn width of a river is not its measured width. Zooming in a GIS never adds detail beyond the detail with which the data were captured. Pro shows the current scale as an RF at the bottom of the map view; typing a value sets it.
On a flat map the stated scale is exactly true only along certain lines or at certain points. The ratio of the actual scale at a place to the stated scale is the scale factor. The rest of this chapter is about where, and by how much, the scale factor departs from 1.
Projection: from round to flat
A map projection is a systematic, mathematical way of representing the curved Earth on a plane: a formula that takes each latitude and longitude to an x and a y. The result is a projected coordinate system (PCS), which combines a GCS, a projection with its parameters and a linear unit, usually metres or feet.
A curved surface cannot be flattened without stretching; pressing a piece of orange peel flat shows the same effect. Every projection distorts at least one of four properties: shape (the angles that make small shapes look right), area, distance and direction. No flat map keeps all four. Each projection is designed to keep some of them in certain places, at the cost of greater distortion elsewhere. Over a town the distortion can be too small to measure, but over a continent or the world it is clearly visible.
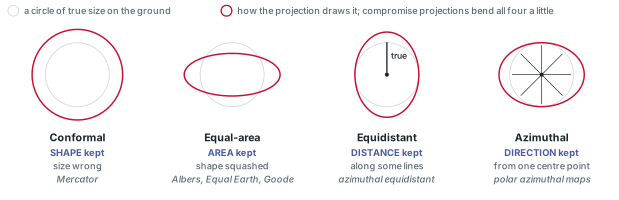
The standard way to show distortion is Tissot's indicatrix: an infinitely small circle on the Earth projects as a small ellipse whose shape and size show how the map stretches at that location. The course applies the same idea with circles large enough to see: 55 circles, each 500 km in radius on the ground, placed every 30° of latitude and longitude. Because every circle has the same true size, any change in their size or shape on a map is caused by the projection. On a conformal map they stay round but change size; on an equal-area map they keep their area but are squashed into ovals.
What a projection keeps
Projections are grouped by the property they preserve.
- Conformal projections keep local angles, so small shapes are right; areas are enlarged or reduced. Nearly all large-scale topographic mapping is conformal.
- Equal-area projections keep relative sizes: a coin placed anywhere covers the same true area. Shapes are distorted over most of the map.
- Equidistant projections keep true scale from one or two points, or along the meridians; no map keeps every distance true.
- Azimuthal projections keep true directions from one centre point. Azimuthal combines with the others: an azimuthal map can also be conformal, equal-area or equidistant.
- Compromise projections keep nothing exactly but balance the errors so none is large.
- Interrupted projections cut the globe, usually through the oceans, into lobes with their own central meridians, so that the shapes of the land areas are less distorted.
Only one pair of properties is mutually exclusive: no map can be both conformal and equal-area. The course's azimuthal example is also equidistant, and its interrupted one is also equal-area.
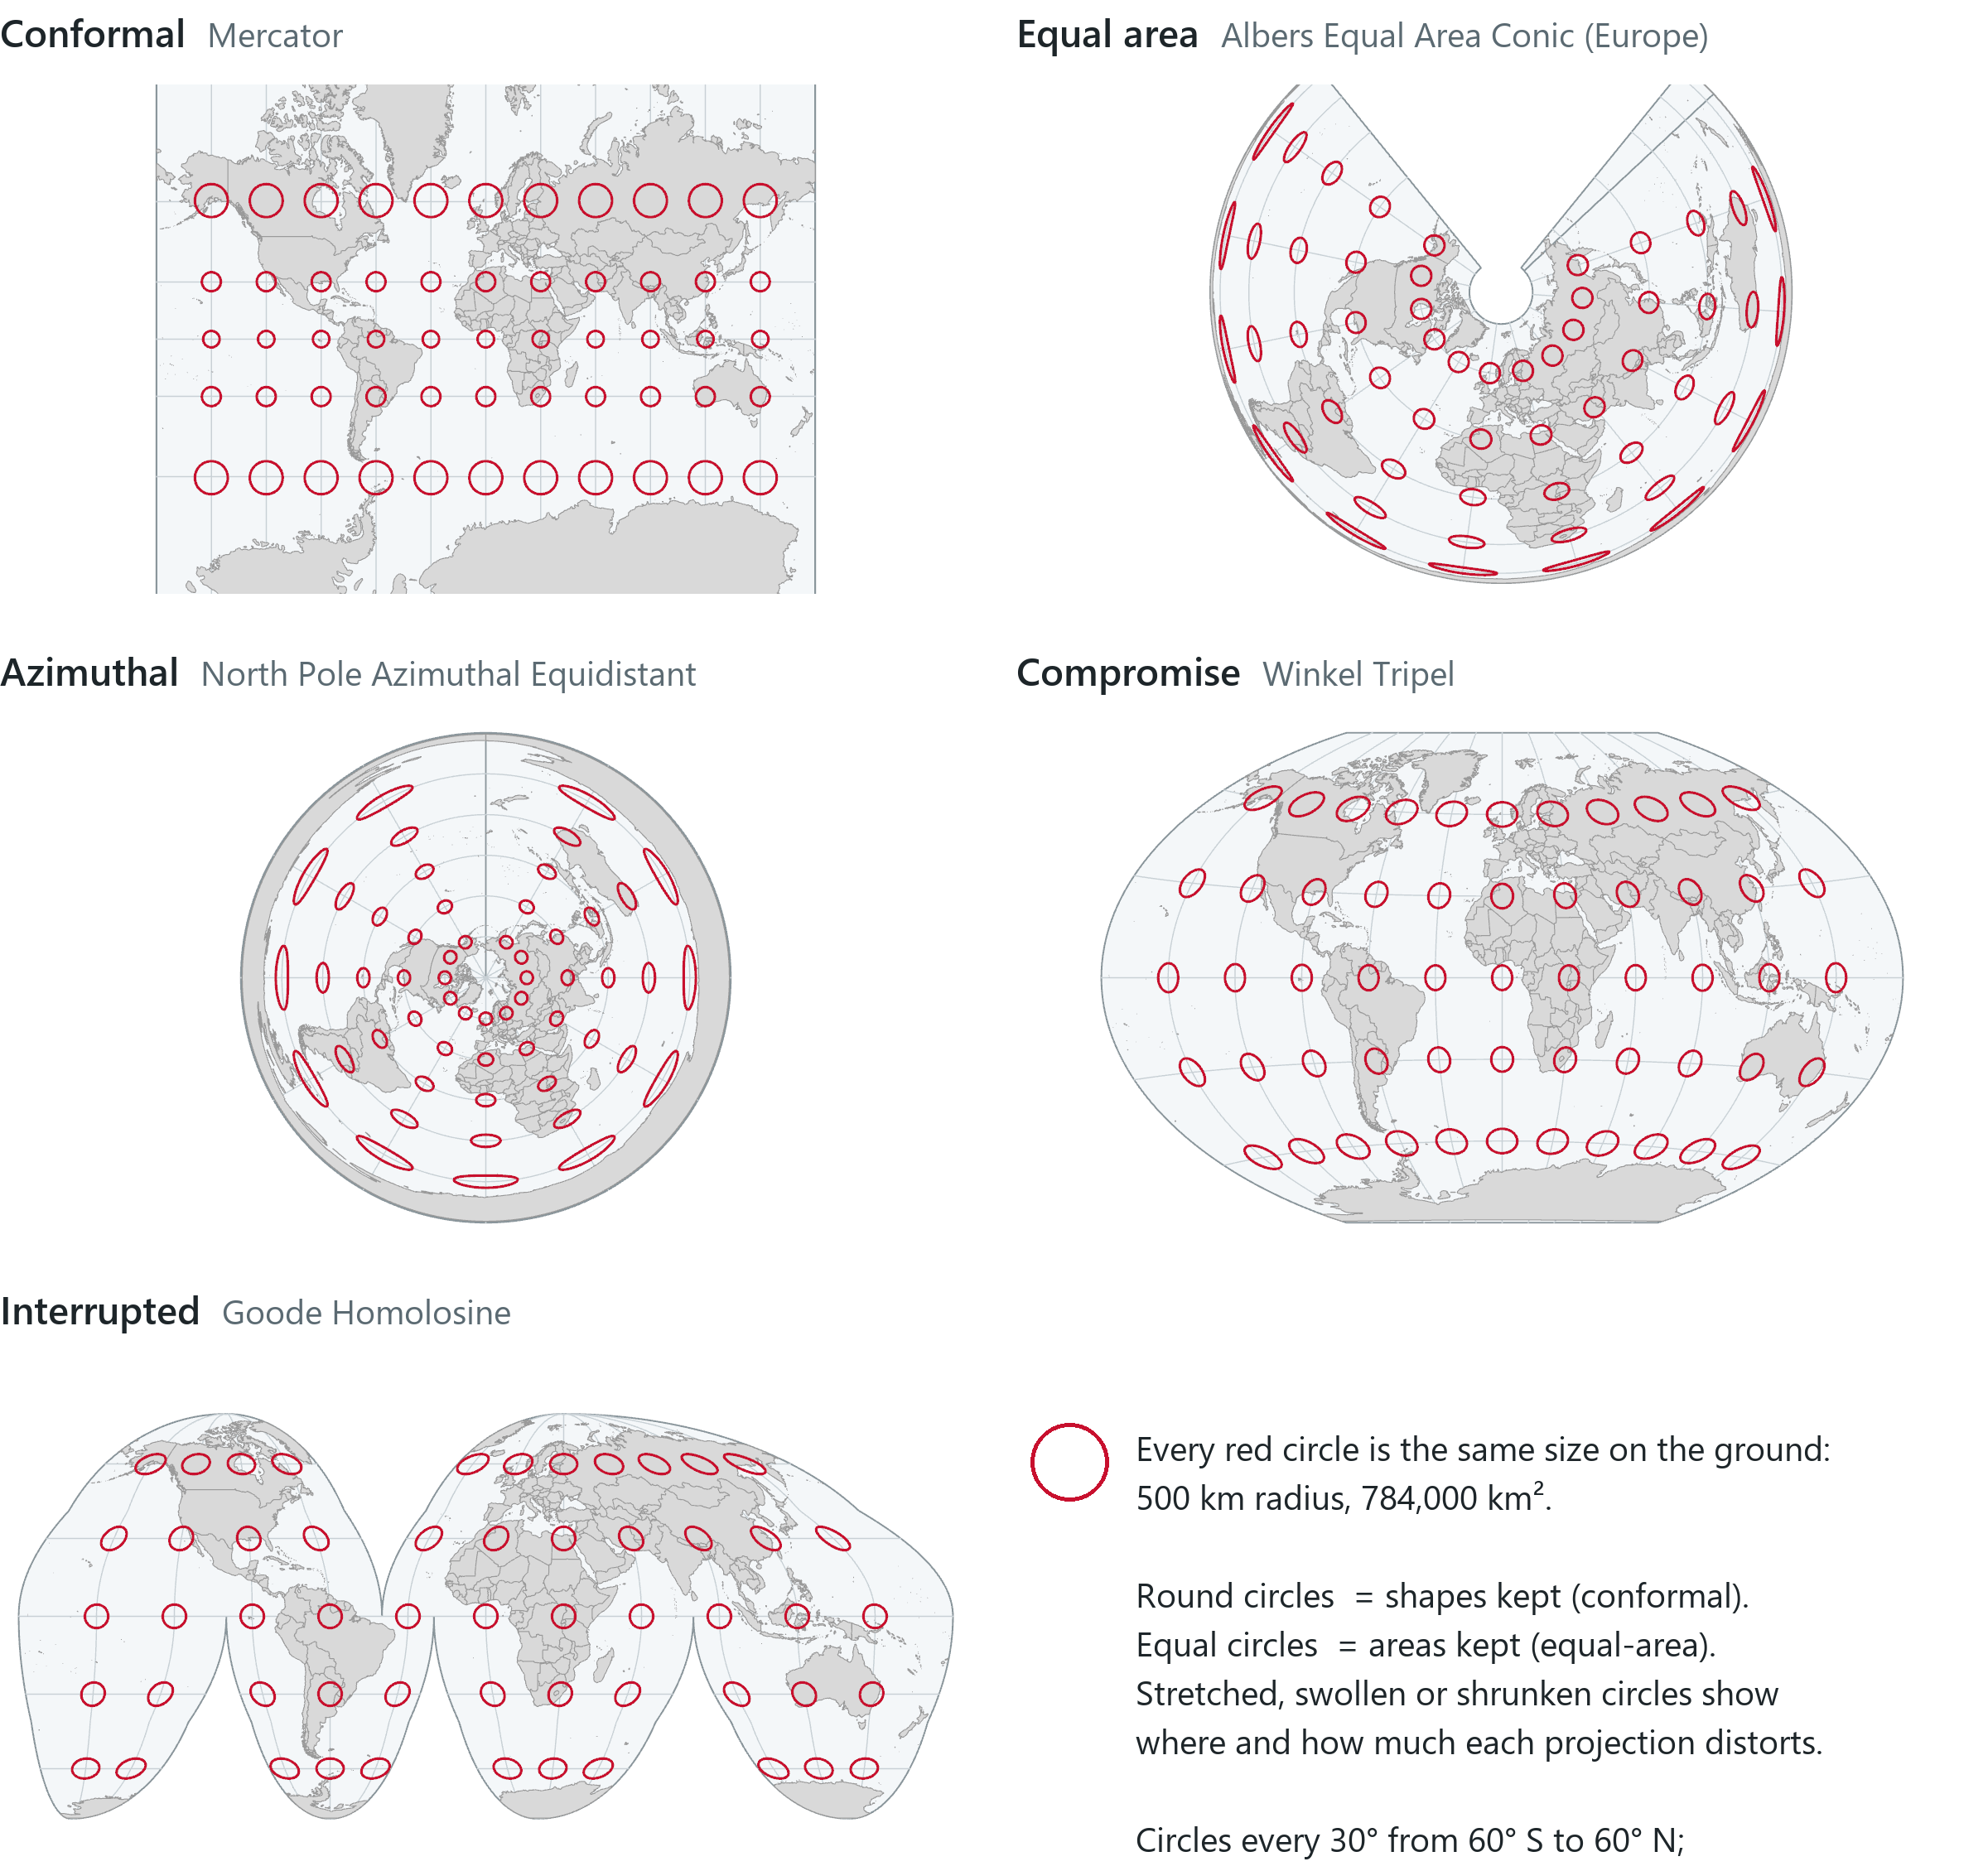
The circles show how each projection in the gallery distorts. On Mercator they stay round and grow larger towards the poles. On the Albers they all cover the same area, but only those near Europe are round. On the azimuthal map they stretch towards the edge, where Antarctica is stretched around the whole circumference. On the Winkel Tripel they are slightly oval everywhere; on the Goode they are equal and fairly round across the land.
Rule of thumb
Choose the projection to suit the purpose of the map. Anything about area or density (a choropleth, a density surface, a world thematic map) should be mapped on an equal-area projection; conformal projections suit reference and navigation maps. Never use Web Mercator for a world thematic map.
Cylinder, cone and plane
Most projections belong to one of three families, named after a surface that can be unrolled flat without stretching, a developable surface. A cylinder wrapped round the globe unrolls into a rectangle, with straight, evenly spaced meridians. A cone set over the globe unrolls into a fan, meridians radiating from its apex and parallels as arcs. A plane touching the globe at one point gives a disc, meridians radiating from the centre at their true angles. The surface gives the family its name and determines the general appearance of the graticule, but the formulas themselves are derived mathematically.
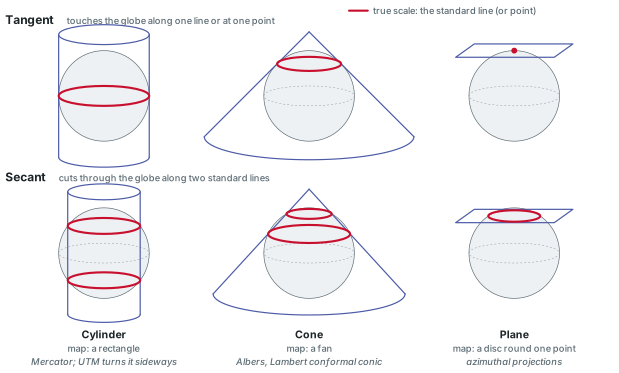
Where the surface meets the globe, scale is true: the scale factor is 1. A tangent surface touches along one line (a plane, at one point). A secant surface cuts through the globe along two lines, the standard lines (for a cone or cylinder, two standard parallels; a secant plane cuts along one circle). Between them the scale is slightly too small, outside them slightly too large, and the low-distortion band is wider than a tangent surface gives. True scale on a standard line does not mean that the map is free of distortion there. The gallery's Albers is a secant cone with standard parallels at 43° N and 62° N, so its circles are round across Europe.
A cylinder can also be turned on its side to touch the globe along a meridian, a transverse cylinder, so that the band of true scale runs north–south. UTM and the national grids described below are based on this arrangement.
The famous projections
A small number of projections are used for most of the world's mapping, and each one makes a different trade-off between the four properties.
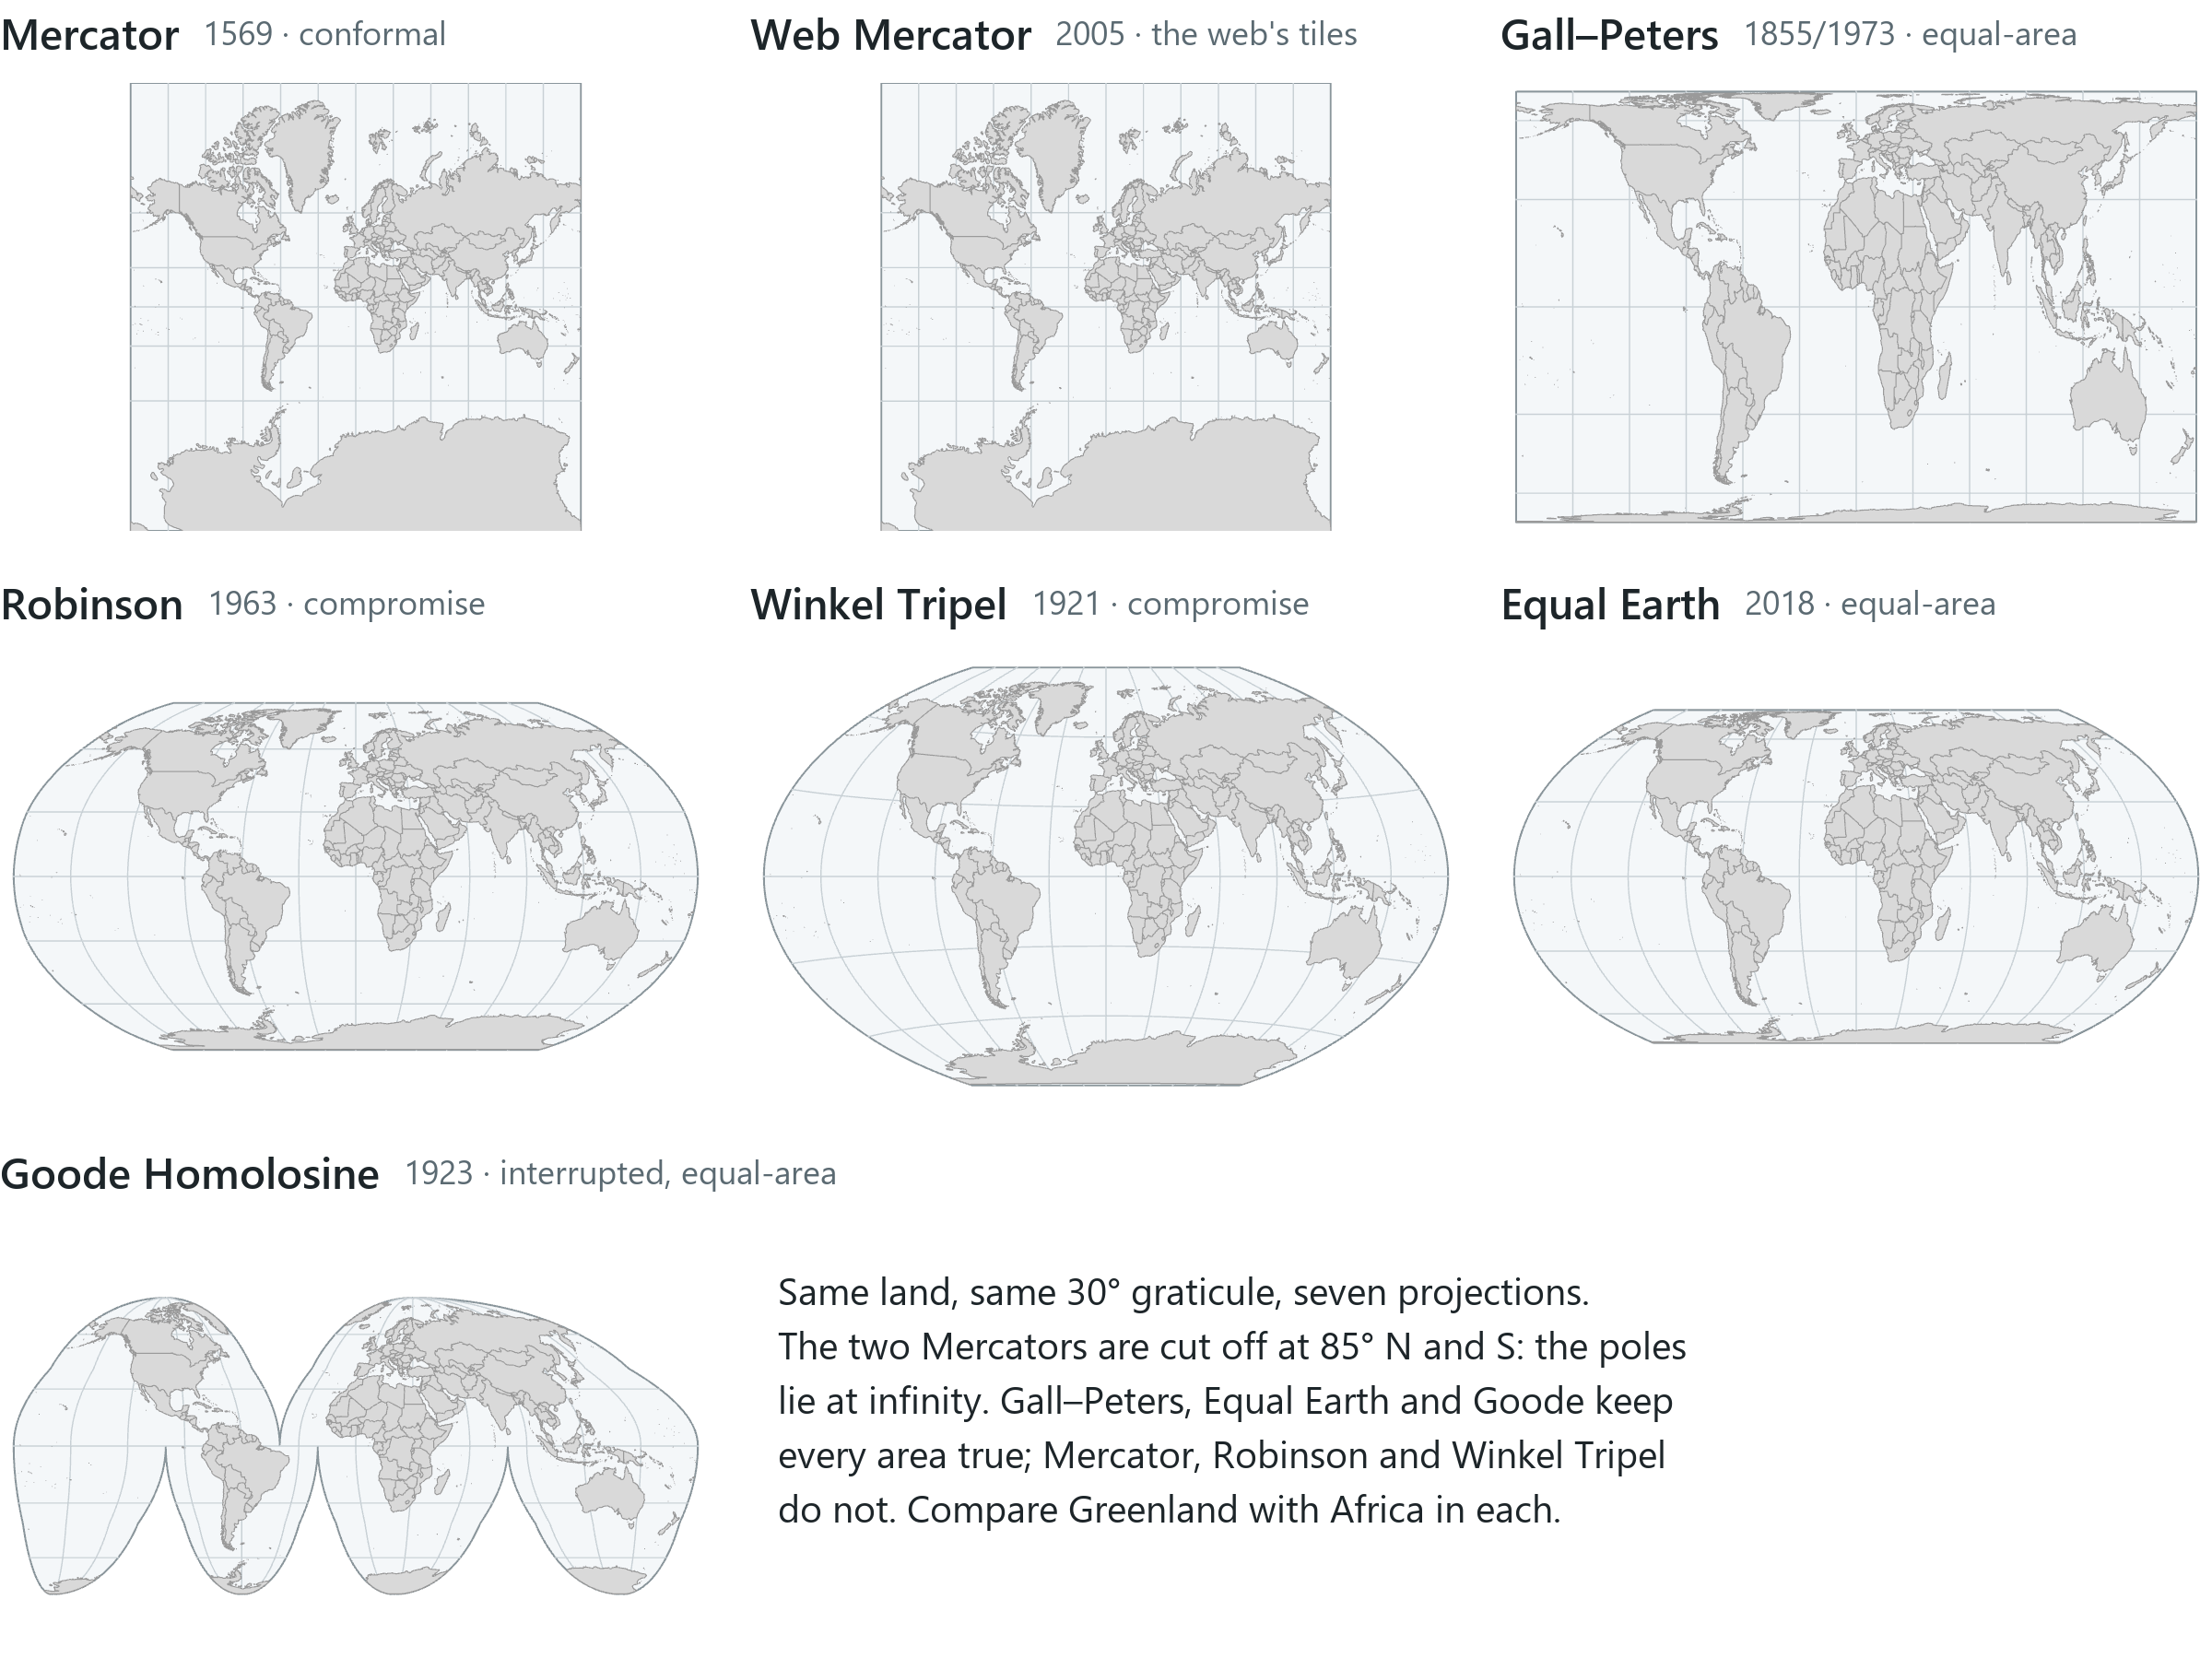
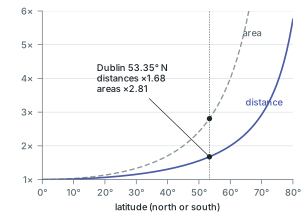
- Mercator (1569) is a conformal cylinder whose parallels are spaced ever wider towards the poles, so that a straight line is a line of constant compass bearing, which made it the standard map for navigation. Scale grows as 1/cos(latitude) and area as its square; Greenland, one-eighth the area of South America, looks almost as large.
- Web Mercator applies the Mercator formula for a sphere to WGS 84 latitudes and longitudes. It is a projected coordinate system (EPSG 3857), the one most web basemaps are drawn in, and not exactly conformal.
- Gall–Peters is a cylindrical equal-area projection with standard parallels at 45° N and S (James Gall, 1855; promoted by Arno Peters from the late 1960s). Areas are true; shapes near the equator stretch north–south.
- Robinson (1963) is a compromise built from tables to make the world "look right"; National Geographic used it from 1988 to 1998.
- Winkel Tripel (1921) is a compromise with small errors everywhere; National Geographic's world maps have used it since 1998.
- Equal Earth (2018) is an equal-area world projection designed to look like the Robinson while keeping every area true.
- Goode Homolosine (1923) is equal-area and almost always shown interrupted, in the form familiar from world atlases.
In the pane
Module 3 lesson 3 covers the four properties, the three surfaces and tangent versus secant, then shows five gallery pictures with the same circles as above. You zoom your own map out to the whole world, switch it to Equal Earth in Map Properties > Coordinate Systems and watch it redraw, compare Greenland with South America, and switch it back to Web Mercator. Last, you drag Ireland north and south on thetruesize.com, a Mercator web map.
Choosing a coordinate system
A world projection has some distortion everywhere. For a city, county or country the usual choice is a zoned system, in which the world is divided into zones small enough that the distortion inside each stays below a set limit.
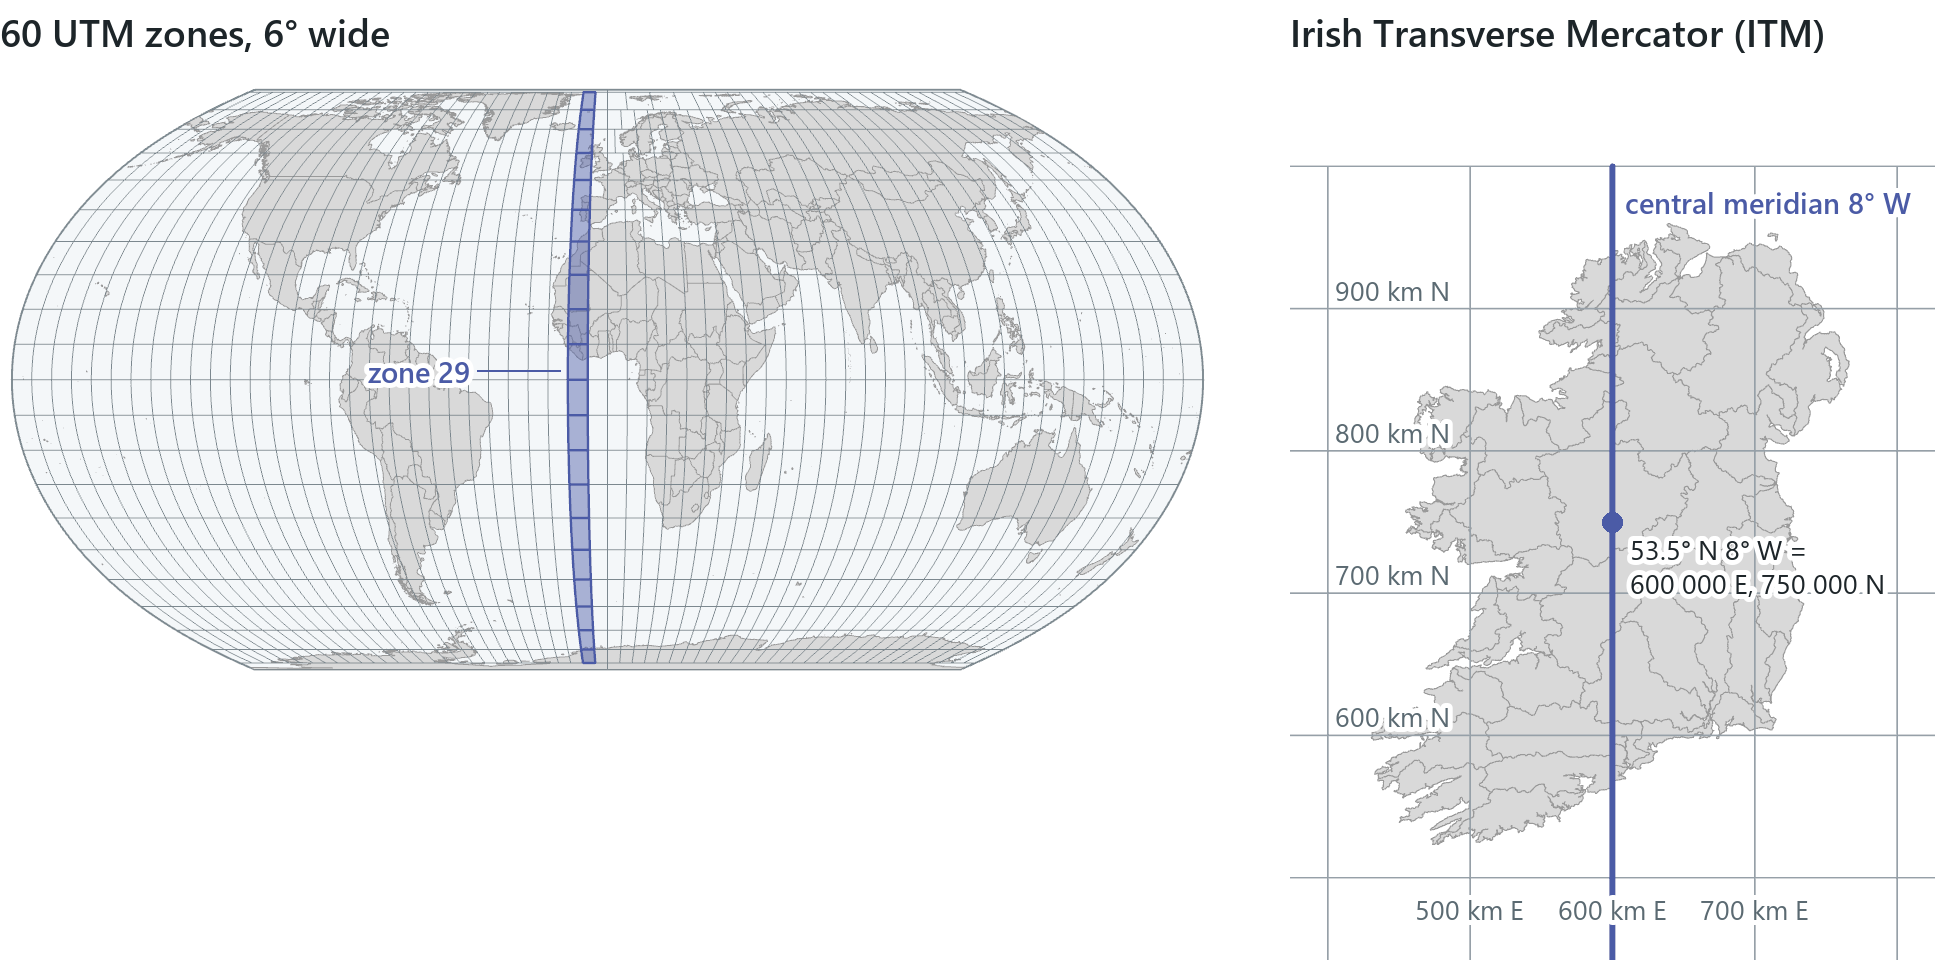
Universal Transverse Mercator (UTM) cuts the Earth into 60 zones, each 6° of longitude wide, from 84° N to 80° S. Each zone is a transverse Mercator with the scale on its central meridian reduced to 0.9996, which makes it secant: scale is true along two lines about 180 km either side, slightly too small between, slightly too large beyond. Coordinates are metres, with a false easting of 500,000 m (and a false northing of 10,000,000 m in the southern hemisphere) so that none is negative. UTM is a grid scheme rather than a datum, so there are WGS 1984, NAD 1983 and ETRS89 versions of each zone. Galway and Dublin both fall in zone 29, whose central meridian, 9° W, runs along Ireland's west coast.
In the United States the State Plane Coordinate System divides each state into zones along state and county lines, each designed to keep scale error within 1 part in 10,000.
Many countries have a national grid. Ireland's is Irish Transverse Mercator (ITM, EPSG 2157), introduced in 2001 as the GPS-compatible successor to the Irish Grid: a transverse Mercator on IRENET95 with its central meridian at 8° W down the middle of the island and a scale factor of 0.99982, which puts the two lines of true scale about 121 km either side. Its origin, 53.5° N 8° W, is given the false coordinates 600,000 m E, 750,000 m N, chosen so that old Irish Grid coordinates interpreted as ITM fall outside the island, which makes a mix-up immediately visible.
Rule of thumb
For a local study area, use the national grid where one exists (ITM in Ireland), otherwise the UTM zone that holds the area. Keep world projections for world maps. The software can draw any data in any coordinate system, so choosing a suitable system is the analyst's responsibility.
Web Mercator: fine for looking, wrong for measuring
Web basemaps are cut into square tiles in Web Mercator, and Pro's maps often start in it because the basemap is the first layer added. It is well suited to displaying the world on a screen but not to measurement. Like Mercator, it stretches lengths by 1/cos(latitude): at Ireland's 53.3° N that is 1.67, so every length is two-thirds too long and every area about 2.8 times too large.
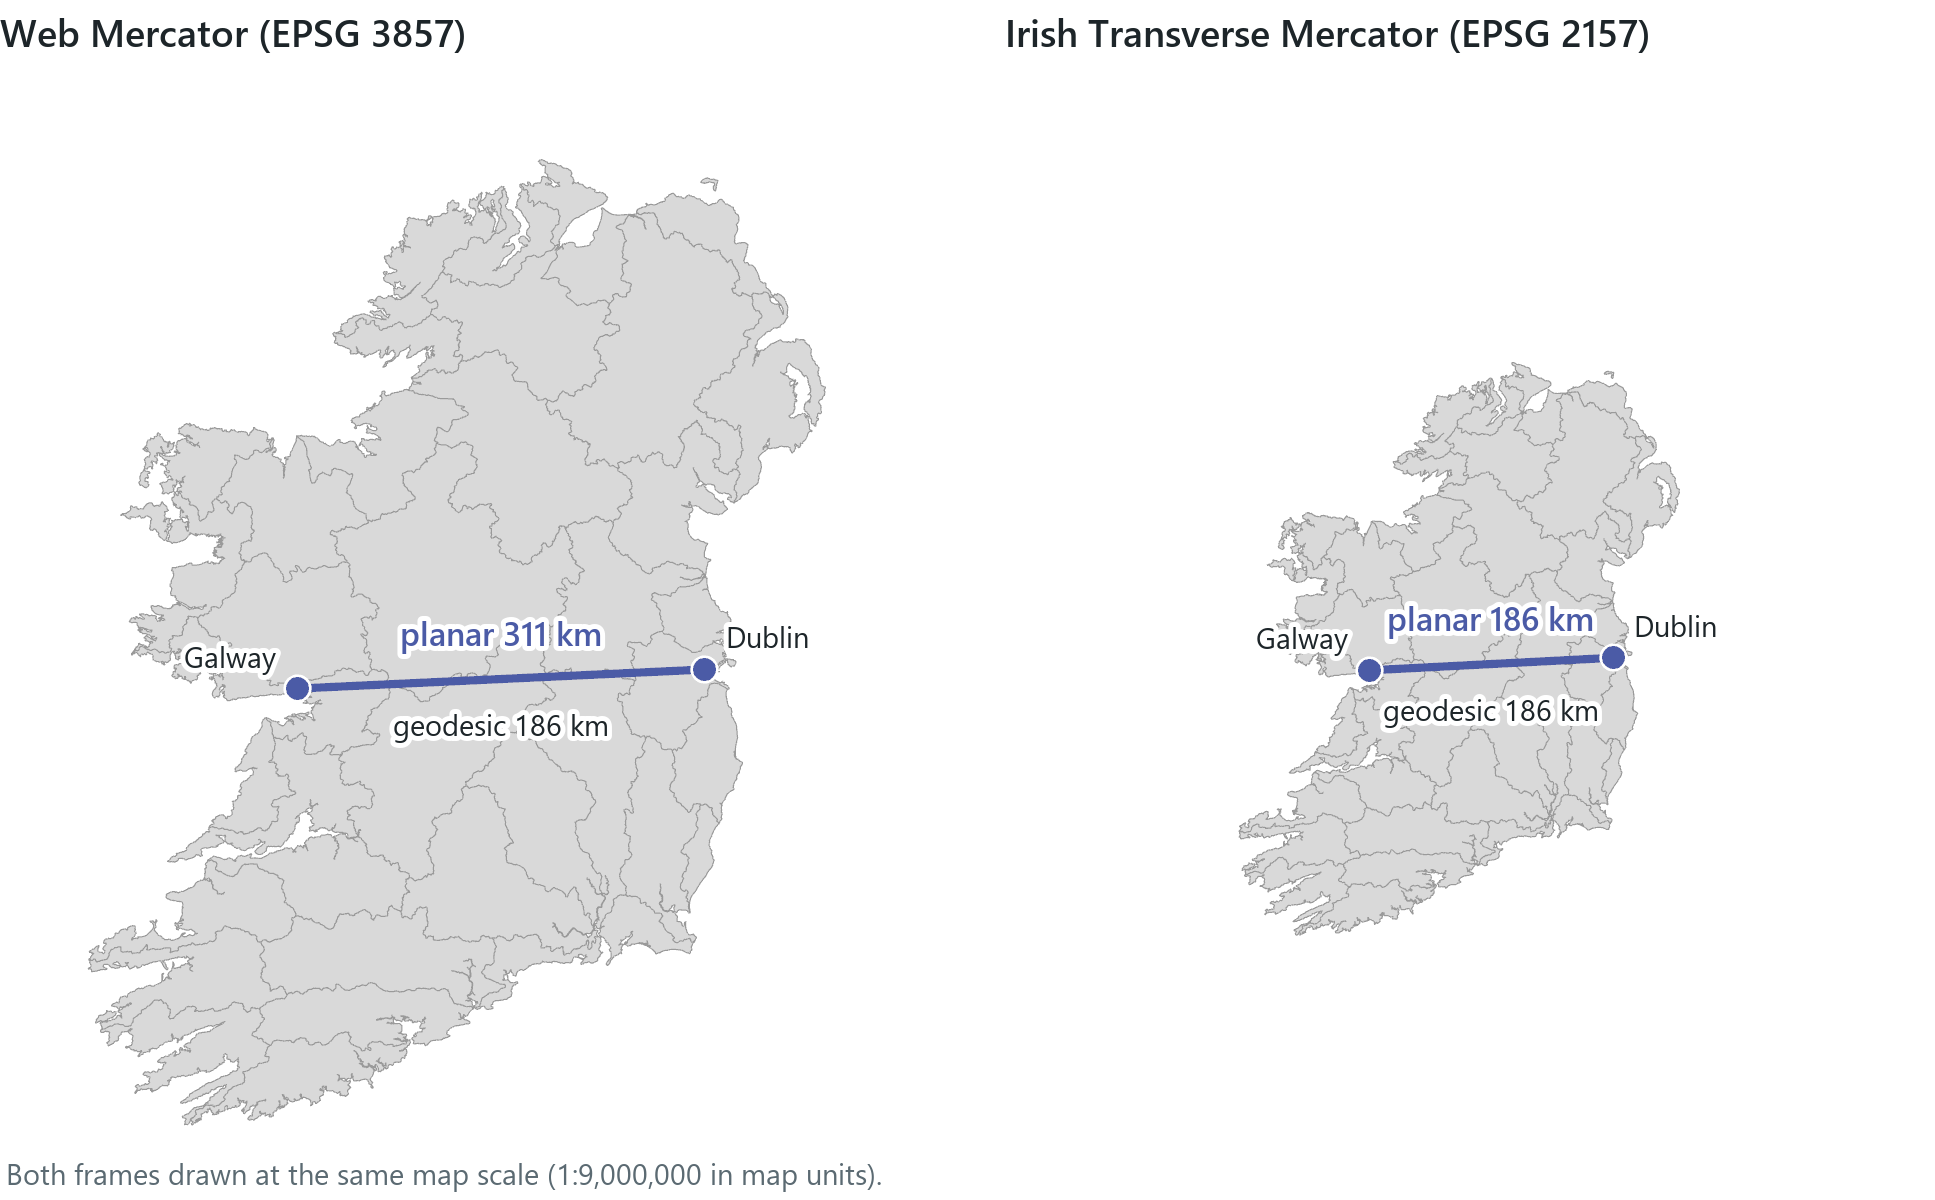
A planar measurement from Dublin to Galway in Web Mercator gives 311.65 km. The geodesic distance, the shortest path along the curved surface of the ellipsoid, is 186.6 km. With the map in ITM, a planar measurement gives 186.57 km. Planar measurement applies flat geometry to the coordinates of the system it is given, so it is only as accurate as that projection is in the area where you work. Many tools can measure either way: Buffer, the Measure tool and the distance tests of Chapter 6 offer a geodesic option, while others (the area and length fields, densities, most overlays) are planar in the data's own system. Check which method a tool uses before relying on its result. A 5 km buffer drawn planar in Web Mercator near Dublin reaches only about 3 km on the ground, and the map gives no visible sign of the error.
Rule of thumb
Never measure planar in Web Mercator. Project the data to an analysis coordinate system before measuring, or use a geodesic method; when a single distance or area is asked for, report both the geodesic and the planar number and why they differ.
In the pane
Module 3 lesson 4 starts with large versus small scale and adds the World UTM Grid to find Galway's zone. You measure Dublin to Galway with the Measure tool, planar then geodesic, in Web Mercator; then you switch the map to ITM by searching 2157 (Esri's list spells it "IRENET95 Irish Tranverse Mercator") and measure again. Waldo checks your readings and runs its projection check, which recommends ITM for Irish data.
Map units, on-the-fly projection and transformations
A layer keeps the coordinate system it was stored in. The map has one of its own, usually set by the first layer added, and each time it draws, the software reprojects every layer into it. This on-the-fly projection allows layers from different sources to line up, and it changes nothing stored on disk.
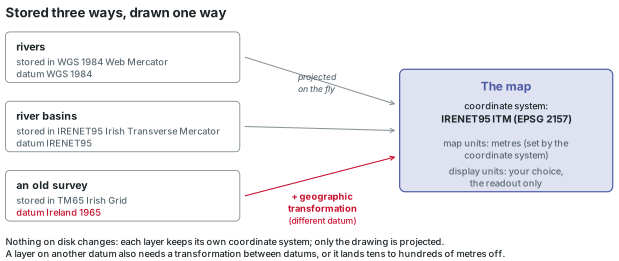
The map's coordinate system fixes its map units: metres for Web Mercator or ITM, degrees for a GCS. Display units only change how the readout and measurements are shown (metres, feet, decimal degrees, degrees-minutes-seconds); they change no coordinates.
When a layer's datum differs from the map's, reprojecting is not enough, because latitude and longitude themselves differ between datums. A geographic transformation converts coordinates from one datum to another, by a published set of shifts, rotations and a scale change or by a grid of corrections, each good to a stated accuracy. NAD 1927 to NAD 1983 needs one; so does Ireland 1965 to WGS 1984. Pro picks a default, or you choose one, on the Transformation tab of the map's properties; choosing the wrong one leaves a layer misplaced by tens to hundreds of metres.
Three operations are easy to confuse. Defining a coordinate system, or repairing a missing or wrong one, tells the software what the stored numbers mean and moves nothing; the right answer is the system the data were made in, never the one that makes the layer look plausible. Projecting computes new coordinate numbers for the same places and writes a new dataset; this is done with the Project tool, covered in a later module. Changing the map's coordinate system changes only how the layers are drawn. The next section shows the effect of a wrong definition: the numbers stay the same, but the layer is drawn in a different place.
Why it matters
The choice of coordinate system affects analysis as well as display. Overlay needs every layer in a common coordinate system on compatible datums. Measurements are only as accurate as the projection in which they are made. A datum mismatch without a transformation shifts one layer against another by tens of metres, enough to put a point on the wrong side of a river or a boundary. A layer whose coordinate system is labelled wrongly keeps its numbers, but they are interpreted differently, and the software draws the data at the location the label implies.
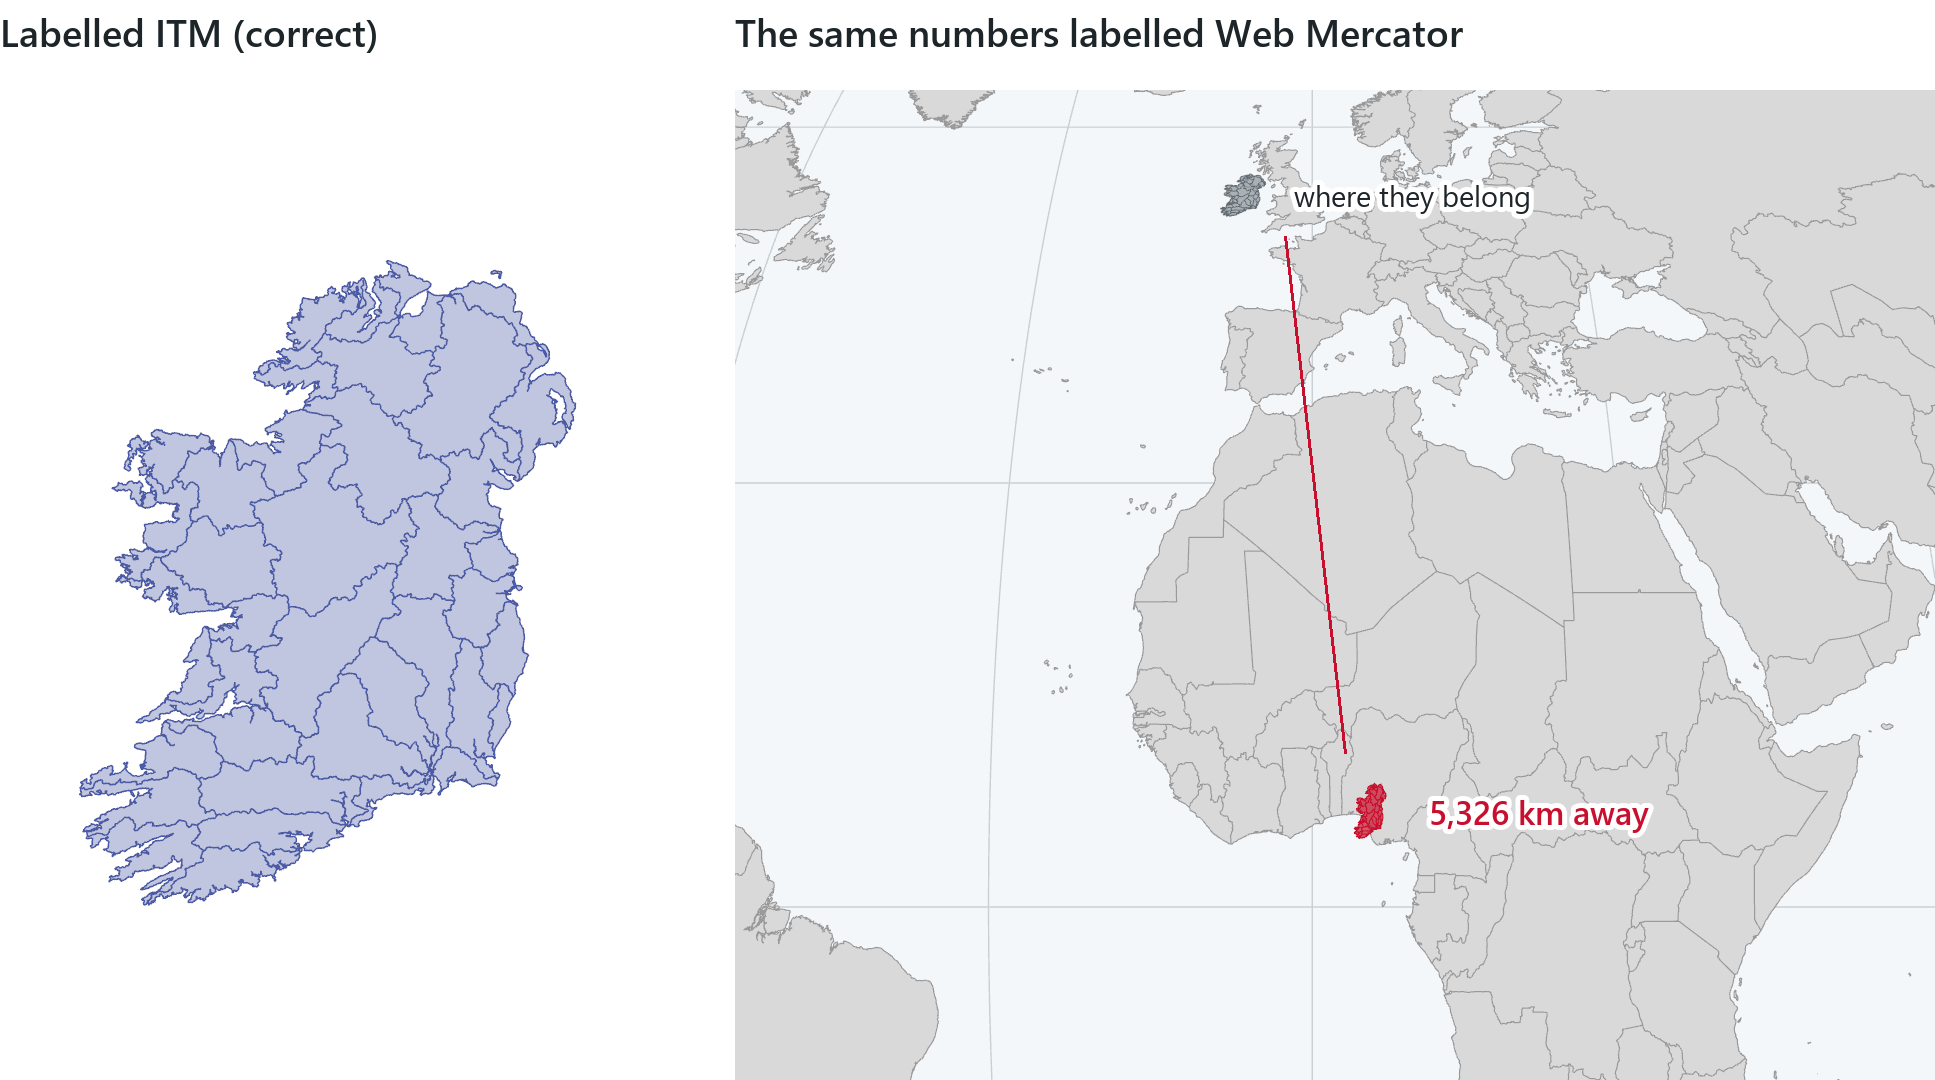
The software will compute in the wrong system and draw a map that looks normal. Checking the coordinate system, the datum and the measurement method (planar or geodesic) is the responsibility of the person doing the analysis, in every analysis.
Rule of thumb
Check the projection before any overlay or measurement: read every layer's datum and coordinate system, choose one analysis system suited to the place and the purpose, and project to it before you measure.
Try it
With a course project open, ask Waldo in Ask mode: which coordinate system is my map in, and which would you use to measure distances here? Waldo reads the map, runs its projection check on a layer and names a system. Compare its answer with the rules of thumb in this chapter.
Key terms
- ellipsoid (spheroid)
- the smooth shape made by rotating an ellipse about its shorter axis; the mathematical model of the Earth, defined by its two semi-axes.
- flattening
- f = 1 − b/a, how much shorter the polar radius is than the equatorial; about 1/298 for the Earth, shown in dialogs as its inverse, 1/f.
- geoid
- the irregular surface of equal gravity potential that mean sea level follows; the reference for heights, within about ±100 m of the ellipsoid.
- datum
- the ellipsoid and its position relative to the Earth, which give latitude and longitude a definite meaning; local datums fit one region, geocentric ones the whole Earth.
- graticule
- the network of meridians and parallels drawn on a globe or a map.
- geographic coordinate system (GCS)
- latitude and longitude in degrees, defined by a datum, a prime meridian and an angular unit.
- projected coordinate system (PCS)
- a GCS plus a map projection and a linear unit, giving flat x and y coordinates in metres or feet.
- map projection
- a mathematical transformation of the curved Earth onto a plane; it always distorts shape, area, distance or direction somewhere.
- representative fraction (RF)
- a map scale written as 1:n, one unit on the map for n of the same unit on the ground.
- large scale / small scale
- a large-scale map (1:10,000) shows a small area in detail; a small-scale map (1:1,000,000) a large area with little detail.
- scale factor
- the actual scale at a point of a projected map divided by the stated scale; 1 on the standard lines.
- conformal
- preserving local angles, so small shapes are true; areas are distorted.
- equal-area
- preserving the relative sizes of areas everywhere; shapes are distorted.
- equidistant
- preserving true scale along certain lines, such as from one or two points to all others.
- azimuthal
- preserving true directions from a centre point; can also be conformal, equal-area or equidistant.
- compromise projection
- a projection that keeps no property exactly but every distortion moderate, such as Robinson or Winkel Tripel.
- developable surface
- a cylinder, cone or plane: a surface that unrolls flat without stretching, used to build and classify projections.
- tangent / secant
- a tangent surface touches the globe along one line or at one point; a secant surface cuts it along two standard lines (a plane along one circle).
- UTM (Universal Transverse Mercator)
- 60 transverse Mercator zones, each 6° wide, with a central-meridian scale factor of 0.9996 and coordinates in metres.
- Irish Transverse Mercator (ITM)
- Ireland's national grid (EPSG 2157): transverse Mercator on IRENET95, central meridian 8° W, scale factor 0.99982, false origin 600,000 m E, 750,000 m N.
- Web Mercator
- the spherical Mercator formula applied to WGS 84 coordinates (EPSG 3857); the system of most web basemaps, stretching lengths by 1/cos(latitude).
- geodesic
- the shortest path between two points along the curved surface of the ellipsoid; geodesic measurement ignores the map's projection.
- planar
- measured with flat geometry in a projected coordinate system, so only as accurate as that projection is where you measure.
- on-the-fly projection
- the software's redrawing of every layer in the map's coordinate system at display time, without changing the stored data.
- geographic transformation
- a calculation that moves coordinates from one datum to another, such as NAD 1927 to NAD 1983, so that data line up.
Further reading
- Snyder, J. P. (1987). Map Projections: A Working Manual. U.S. Geological Survey Professional Paper 1395. https://doi.org/10.3133/pp1395 (src:snyder-1987)
- Snyder, J. P., & Voxland, P. M. (1989). An Album of Map Projections. U.S. Geological Survey Professional Paper 1453. https://pubs.usgs.gov/publication/pp1453 (src:snyder-voxland-1989)
- U.S. Geological Survey. Map Projections (poster). https://pubs.usgs.gov/publication/70047422 (src:usgs-projections-poster)
- NOAA National Ocean Service. Global Positioning Tutorial: Geodesy (the geoid and datums). https://oceanservice.noaa.gov/education/tutorial_geodesy/ (src:noaa-geodesy-tutorial)
- Olaya, V. Introduction to GIS, the chapter on cartography and geodesy. https://volaya.github.io/gis-book/en/ (src:olaya-gis-book)
- Cory, M. J., Morgan, A., Bray, C., & Greenway, I. (2001). "A New Coordinate System for Ireland." FIG Working Week, Seoul. (src:fig-2001-itm)
- Šavrič, B., Patterson, T., & Jenny, B. (2019). "The Equal Earth map projection." International Journal of Geographical Information Science 33(3). https://doi.org/10.1080/13658816.2018.1504949 (src:savric-equal-earth-2018)
- Esri ArcGIS Blog. "Geographic vs. projected coordinate systems." https://www.esri.com/arcgis-blog/products/arcgis-pro/mapping/coordinate-systems-difference (src:esri-blog-gcs-pcs)
- Esri ArcGIS Blog. "Projection on the fly and geographic transformations." https://www.esri.com/arcgis-blog/products/arcgis-pro/mapping/projection-on-the-fly-and-geographic-transformations (src:esri-blog-otf)
- The True Size Of…, an interactive Mercator map for dragging countries north and south. https://thetruesize.com/ (src:thetruesize)
- The course's data sources: every layer the lessons and this chapter's maps use, with its publisher and licence. (src:course-data-sources)